- Home
- Research
- Biophysical Imaging
- Research results
- Biophysical imaging with high spatial and temporal resolution
Biophysical imaging with high spatial and temporal resolution
28.03.2019
Fluorescence microscopy is a powerful tool for observing cellular structures over space and time. Yet, its resolution is usually limited for detailing structures below 200 nm and dynamics in second range only. We here present the development of beam-scanning fluorescence correlation spectroscopy combined with super-resolution STED microscopy providing significantly increased resolutions for determining for example lipid membrane diffusion dynamics.
By Christian Eggeling
Cellular signaling heavily relies on diffusion and interaction dynamics in the cellular plasma membrane, the “gateway” into the cell. Those dynamics are modulated by lateral heterogeneity in molecular plasma membrane organization. This heterogeneity and the underlying structures or molecular interaction dynamics can be probed through investigation of molecular diffusion characteristics in the plasma membrane over space and time. A widely employed approach to explore molecular diffusion in the plane of the cellular plasma membrane is fluorescence correlation spectroscopy (FCS). FCS is usually employed to determine the average transit times (τD) of molecules through the observation volume of a confocal microscope to obtain values of the diffusion coefficients (D), revealing changes in molecular diffusion due to, for example, changes in membrane viscosity or molecular interactions. Additionally, FCS allows studying non-Brownian hindered diffusion caused by molecular interactions and confinements, disclosed by the molecules’ diffusion modes. Such modes can be measured by recording FCS data for observation spots of varying sizes, allowing for the determination of the dependence of τDand D on the diameter d of the observation spots. From τD(d) (or D(d)), one may for example distinguish between free (Brownian) diffusion and transient trapping in slow moving or immobilized entities (trapped diffusion). Unfortunately, parameters such as dwelling times or sizes of the trapping sites can on a conventional confocal microscope only be extrapolated, since the relevant molecular scales are below the diffraction-limited (d~240nm). A remedy to this limitation is to realize FCS recordings with sub-diffraction sized observation spots (e.g. from d~240nm down to d<50nm), as created by super-resolution STED microscopy. To thoroughly understand the spatial heterogeneity and related spatial diffusion modes, FCS data needs to be recorded simultaneously at various points, as done for scanning STED-FCS (sSTED-FCS), where multiple FCS data are recorded simultaneously for each pixel along a quickly scanned line. Unfortunately, sSTED-FCS so far has not been able to accurately characterize diffusion modes, since values of τD(or D) could only be determined for one observation spot diameter d at a time. We here developed line interleaved excitation scanning STED-FCS (LIESS-FCS), which by fast beam-scanning along a line with alternating laser illumination, provides, for each pixel, apparent diffusion coefficients for two different observation spot sizes, one corresponding to the diffraction-limited confocal and the other to super-resolved STED microscopy recordings. We validated our LIESS-FCS approach with investigations of nanoscale lipid diffusion modes in the plasma membrane of live cells, highlighting transient interaction (or trapping) sites for specific lipids.
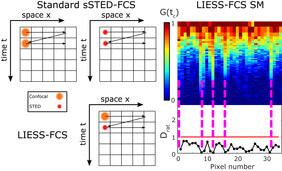
More specifically, in sSTED-FCS either the larger confocal (dconf~240nm) or smaller STED (dSTED<<200nm) observation spot is quickly and multiple times scanned over the sample along a line (or a circle), creating temporal intensity data over time for each line pixel. Subsequent calculation of the temporal correlation function for each pixel generates the autocorrelation functions summarized in space in the so-called correlation carpets. Fitting of each correlation curve reveals values of τDand of the apparent diffusion coefficient Dconf= D(dconf) and DSTED= D(dSTED) for confocal and STED recordings, respectively. In sSTED-FCS, Dconfand DSTEDcan only be determined subsequently, not simultaneously. Since diffusion characteristics may have changed at the individual pixels in-between confocal and STED recordings due to global cell dynamics (e.g. cellular movements, variations in the plasma membrane topology), values of Dconfand DSTEDcannot be paired to determine spatially resolved D(d) dependencies. In contrast, in LIESS-FCS, the confocal and STED-based observation spots are scanned in an alternating manner (line-by-line basis), creating correlation carpets for confocal and STED modes and thus values of Dconfand DSTEDfor each pixel quasi-simultaneously within the same measurement. This now enables direct disclosure of diffusion modes for each pixel by relating values of Dconfand DSTEDby calculating calculation of the ratio Drat= DSTED/Dconffor each pixel. Values of Dratgive unique information on the nanoscale diffusion characteristics, since they vary for different nanoscale diffusion modes: Drat= 1 for free and Drat< 1 for trapping diffusion.
We used LIESS-FCS to investigate in detail the diffusional characteristics of fluorescently labelled phosphoethanolamine lipid (DPPE) and compare it with a fluorescently labelled sphingomyelin lipid (SM) in the plasma membrane of living cells. Previous sSTED-FCS experiments have demonstrated mainly free homogeneous diffusion for DPPE and spatially distinct spots of slowed down diffusion in the case of SM, only visible in the STED recordings. However, due to the lack of simultaneous information from confocal recordings, this observation using sSTED-FCS could not directly be attributed to trapping interactions. The LIESS-FCS modality now allows to directly link these spots to trapped diffusion, since Dratis << 1.0 at these spatial positions only, while Dratis close to 1.0 in-between (almost free diffusion as continuously detected for DPPE). Therefore, any other spatial heterogeneity showing up, such as already in the confocal correlation carpets of DPPE, are still characterized by free diffusion, i.e. they do not relate to trapping interactions despite the obvious heterogeneity. A possible cause for such heterogeneity may be the uneven plasma membrane topology involving curvatures.
Overall, our data demonstrate the capability of LIESS-FCS to directly observe spatial heterogeneity in molecular diffusion behavior (such as spatially distinct sites of trapping diffusion). Consequently, LIESS-FCS provides a unique tool for investigating lateral organization of cellular membranes on variable length scales accounting for bias due to biological heterogeneity or photobleaching artefacts, and for possibly answering long-standing questions of functional membrane heterogeneity.