Smart residual sum of squares allows correction of systematic errors
2. Februar 2022
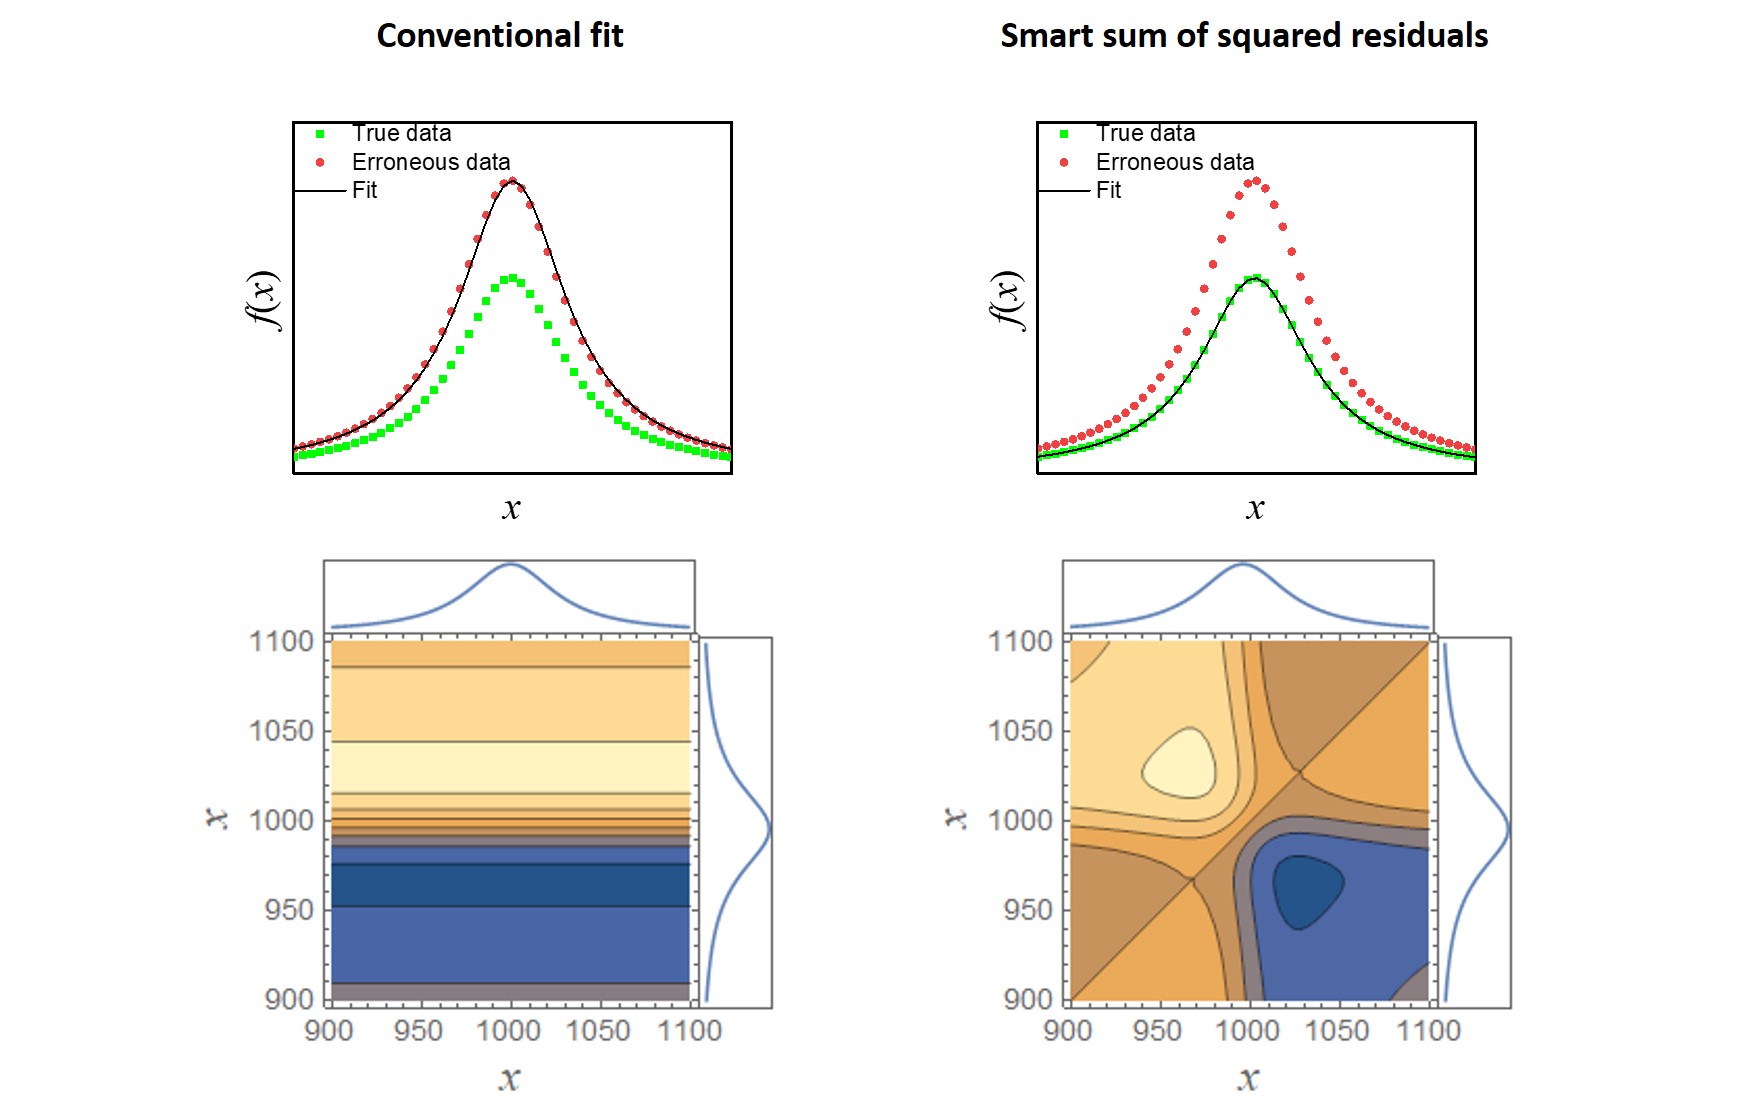
Determining the true value of a physical or metrological quantity is essential in statistics. In the absence of bias, the median or arithmetic mean can be excellent estimates of this true value. Otherwise, significant deviations may occur. Fitting methods optimize the parameters of a given function in such a way that the deviations between measured and calculated curves are minimized. The prerequisite for the application of fitting methods is therefore that the measurements are free of systematic errors. Scientists from the Leibniz Institute of Photonic Technology (Leibniz-IPHT) in Jena developed an “intelligent” residual sum of squares that cannot only be used despite systematic errors but can also correct them.
In spectroscopy, fitting methods based on the residual sum of squares are applied in order to adapt simulated to the measured spectra and to determine band positions, half-widths and areas (band fitting). However, the result of curve fitting can still look reasonable, even if the spectra contain systematic errors, for example due to thermal fluctuations. This leads to erroneous results and since the magnitude of the systematic error is usually unknown, a correction cannot be made. The approach recently developed at Leibniz-IPHT can address this problem.
The researchers use a method that can quantify correlations between different curves. This so-called 2D correlation analysis has proven itself to be invaluable in the field of spectroscopy and has been used for many years with different spectroscopic methods, such as IR, UV/VIS, and Raman spectroscopy. With 2D correlation spectroscopy, linear and non-linear variabilities of spectra based on systematic changes of boundary conditions are represented semi-quantitatively. In this way, for example, overlapping peaks can be identified and coincident processes can be separated.
The scientists use 2D correlation analysis to compare series of measured and simulated IR spectra. Based on symmetry conditions, the smart residual sum of squares was derived from this comparison. “Our original intention was to use 2D correlation analysis to quantitatively estimate the correlations between two series of spectra. Since we mainly deal with the quantitative analysis of IR spectra, it made sense to use this method to quantitatively compare series of measured and simulated spectra,” explains Dr. Thomas Mayerhöfer from the department spectroscopy/imaging at Leibniz-IPHT.
At the institute in Jena, dispersion analysis is used for the quantitative evaluation of IR spectra. Dispersion analysis is based on wave optics and dispersion theory and allows not only the determination of the oscillator parameters, but also that of the functions of the optical constants. When dispersion analysis is combined with the smart loss function, unphysical reflectance or transmittance values greater than unity are ignored and the results agree with those obtained by the analysis of error-free spectra.
The method is not limited to the analysis of spectra and can be used wherever and whenever experimental curves are modeled with physical or mathematical functions. “We recently adapted the method of 2D correlation spectroscopy, in which a series consists of only two spectra, correspondingly so that one of the spectra represents the experimental spectrum and the other the simulated spectrum. This means that individual curves can also be fitted with the help of the corresponding smart residual sum of squares,” Mayerhöfer continues. Since the conventional residual sum of squares is used in deep learning, interesting applications can also be foreseen in this area.
The results as well as the principles of the method were published in the renowned journals Analytical Chemistry and Applied Spectroscopy.
Scientific publication
T. Mayerhöfer et. al.: Hybrid 2D Correlation-based Loss Function for the Correction of Systematic Errors. Analytical Chemistry, (2021), https://doi.org/10.1021/acs.analchem.1c02830
T. Mayerhöfer et. al.: Smart Error Sum Based on Hybrid Two-Trace Two-Dimensional (2T2D) Correlation Analysis. Applied Spectroscopy, (2022), https://doi.org/10.1177/00037028221077310
Contact

Scientific Contact