- Home
- Research
- Photonic Data Science
- Research results
- Open Source Implementation of Two-Dimensional Correlation Analysis – The corr2D Package in R
Open Source Implementation of Two-Dimensional Correlation Analysis – The corr2D Package in R
05.08.2020
Two-dimensional correlation analysis is a sophisticated data analysis method used to investigate spectral changes that occur with respect to an external perturbation. We developed an open-source software package “corr2D” to allow spectroscopists to use this sophisticated data analysis technique and to make two-dimensional correlation analysis more accessible and transparent.
By Thomas Bocklitz
INTRODUCTION TO 2D CORRELATION ANALYSIS
Infrared (IR), Raman, and nuclear magnetic resonance (NMR) spectroscopy are utilized to study molecules. This is done by assigning spectral signals to molecular structures or molecular properties. This procedure is problematic if a series of spectra is analyzed and the spectral signals strongly overlap. To solve this issue, two-dimensional (2D) correlation analysis was developed. This method was derived from the general auto- and cross-correlation integrals in the 1990s. By applying correlation analysis, a researcher can analyze how similar (or dissimilar) two spectral signals change with respect to some external variables. As described, 2D correlation analysis is employed in spectroscopy and spectrometry if spectral features need to be studied which may be obscured or overlapped in classic one-dimensional (1D) plots of the spectra. 2D correlation analysis has many applications in spectroscopy, especially in the study of dynamic systems when a perturbation occurs. It is widely applied to analyze IR, Raman, NMR, UV/Vis, and mass spectra of polymers, reaction solutions, and pharmaceuticals.
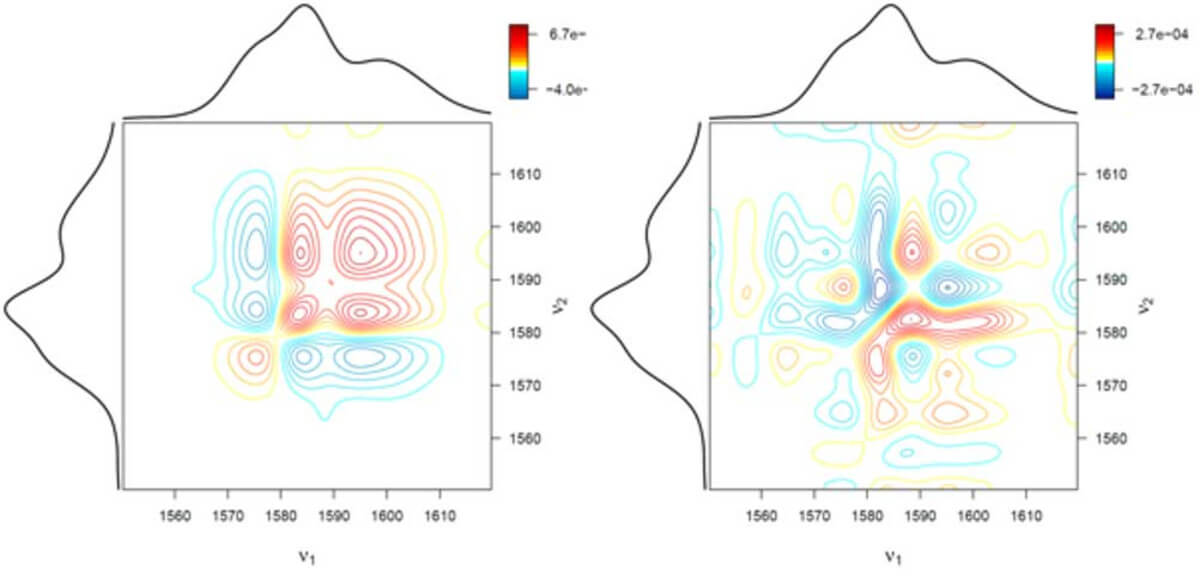
The 2D correlation analysis yields a quantitative description of the behavior of the two spectra with respect to an external perturbation variable. The results of a 2D correlation analysis is the synchronous (Figure 1, left) and asynchronous correlation spectra (Figure 1, right), which can be interpreted according to the Noda rules. Using these rules, it is possible to understand in which sequence the spectral signals occur; using combinatorics, the signals can be attributed to the species involved.
DEVELOPMENT OF OPEN SOURCE IMPLEMENTATION IN R
To make the 2D correlation analysis accessible for a spectroscopist, we developed an open-source R package. To make the method transparent, we showed how the mathematical equations are translated into R code. Additionally, the paper [1] features a simple tutorial with executable code for beginners; it characterizes how fast the implementation is, especially with respect to the parallelization of the fast Fourier transformation-based correlation analysis. The R package “corr2D” offers the possibility to use 2D correlation analysis in the open-source language R; thus, the full data analysis chain from the pre-processing to the correlation to the post-processing of the spectroscopic data can be performed with a single software.
SPEED TESTS
The R package “Corr2D” uses parallelization to speed up the calculation process of the fast Fourier transformation involved. In the paper [1], the influence of the parallelization and the influence of the input matrix dimensions was tested and a benchmark with simulated data performed. The simulated spectral data contained a consecutive first order reaction, and this reaction was utilized in Noda et al [2]. The calculations were done with a few cores, and we compared the computational time for our software and a commercial-available software called “2DShige”.
The speed test revealed that the parallelization speeds up the calculation of large input matrices while it slows down the calculation for smaller input matrices. This is clear because small tasks need to be transferred to the calculating cores. Later the results of all these small calculations need to be put together as a result of the parallelized calculations. Thus, a parallel computation is always a trade-off between speeding up the calculation process and increasing the amount of traffic needed to organize the parallel computation. For small input matrices the correlation speed differences are hardly noticeable, while the speed differences are much larger if the input matrices are getting bigger.
IMAGING CAPABILITIES AND PLOTTING
Another advantage of the R language is its excellent plotting capabilities. We generated a function which allows the easy generation of conventional 2D correlation spectra shown in Figure 1, as well as advanced 3D visualization such as the ones shown in Figure 2.
2D correlation spectra: Asymmetric 2D correlation spectrum (right) and symmetric 2D correlation spectrum (left)
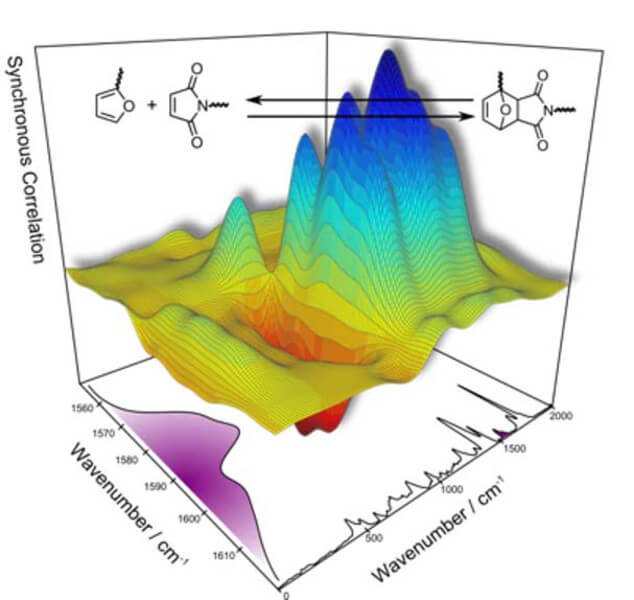
Asymmetric 2D correlation spectrum in 3D